%20(2).png)
In today’s competitive tech landscape, clear and current compensation benchmarks are key to attracting and retaining top talent. At Artemis, we regularly speak with Customer Success leaders across high-growth startups and scaleups, from Managers to VPs, and compensation is a constant theme.
Whether you’re hiring or assessing your own market value, this guide shares real-time salary insights from recent searches and candidate conversations to help you navigate today’s market with confidence.
Note: Be sure to subscribe to our Artemis Update and check out our archive of past issues for updates on big leadership moves and opportunities in tech!
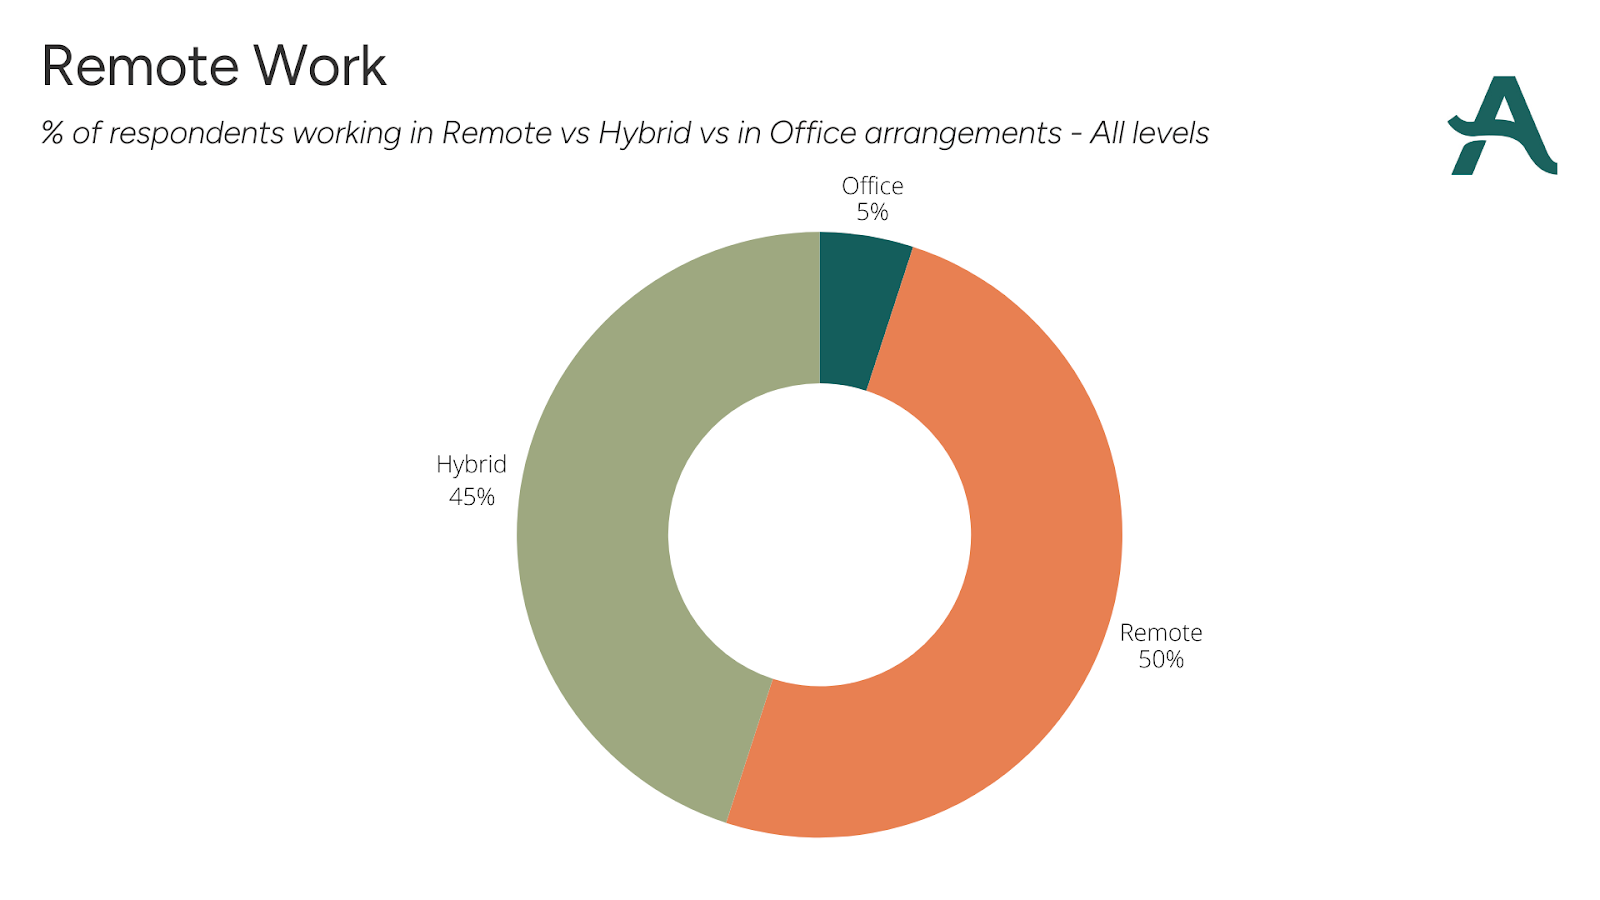
Remote Work Trends:
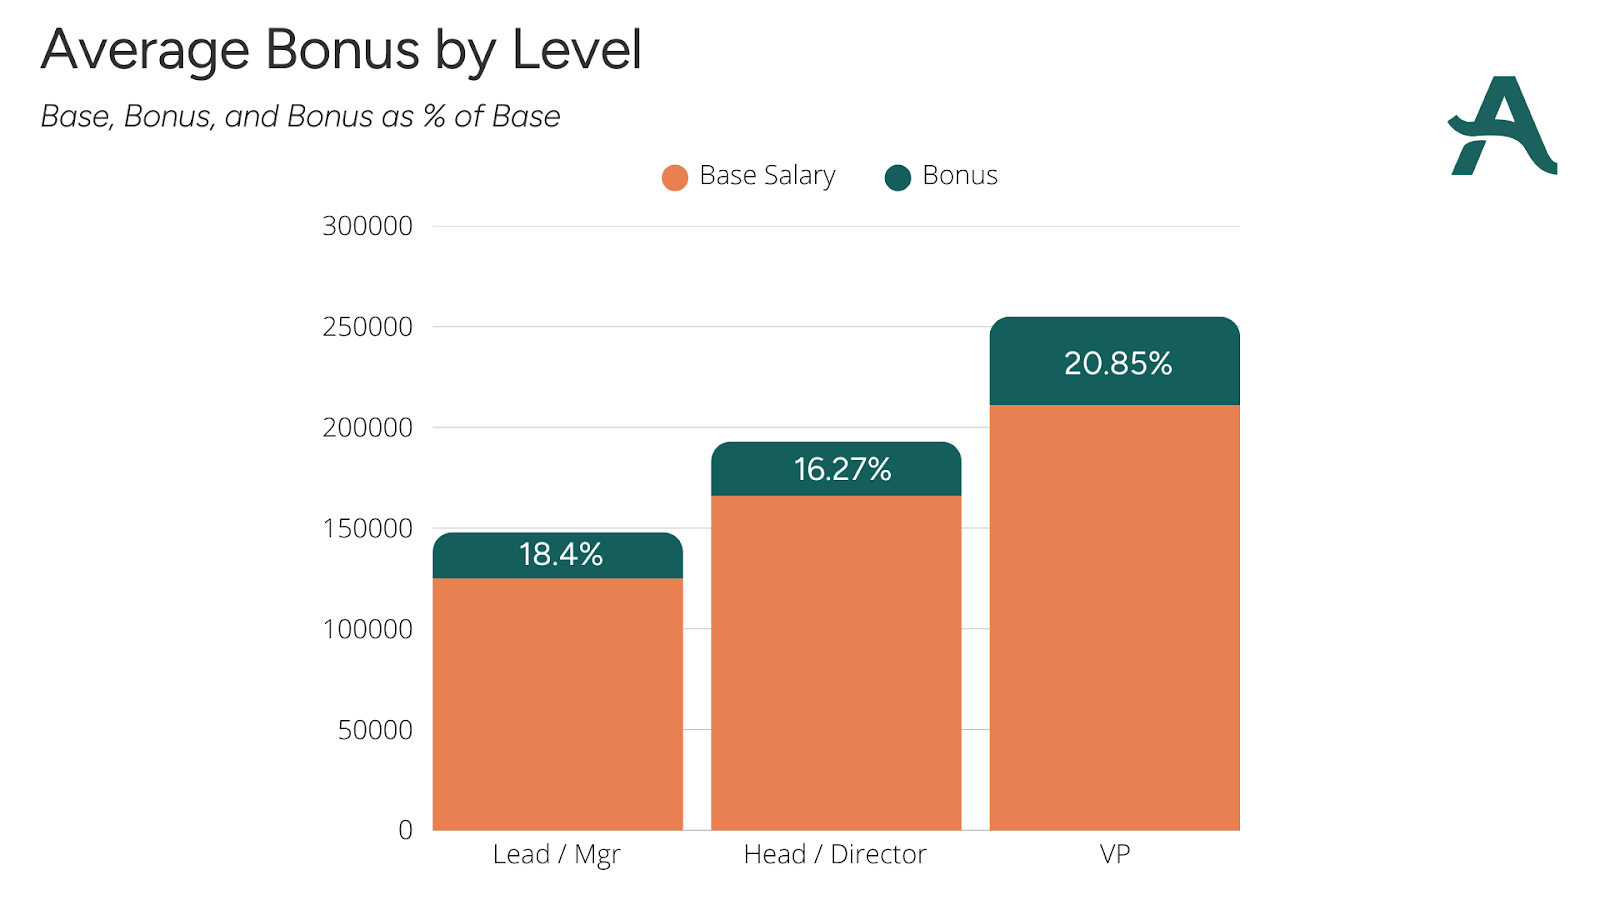
Bonus Structures
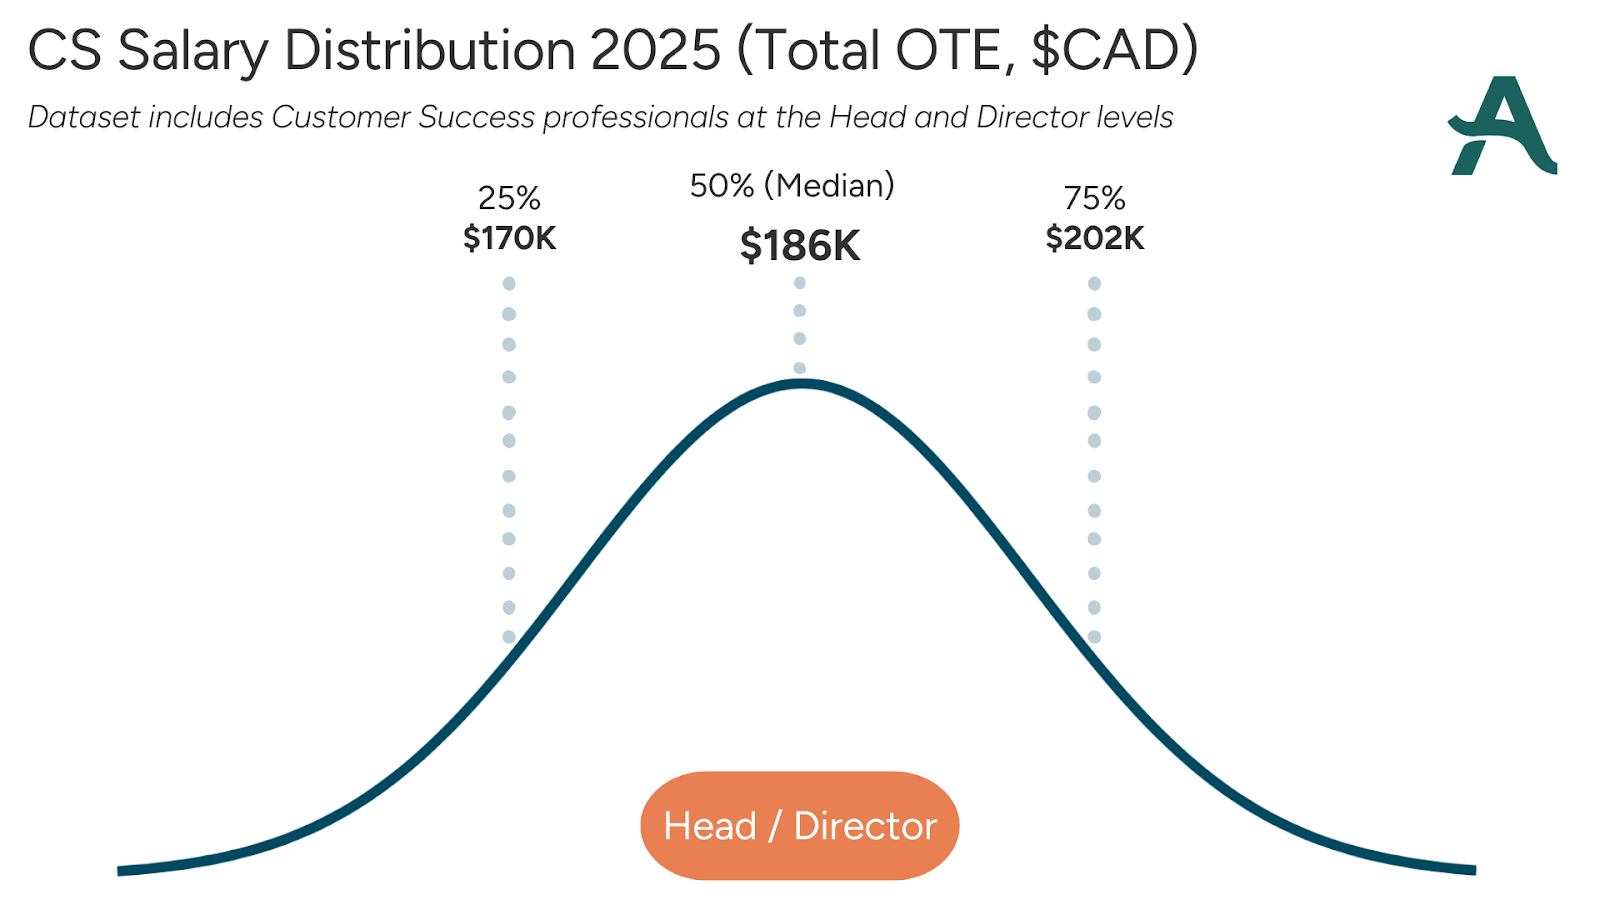
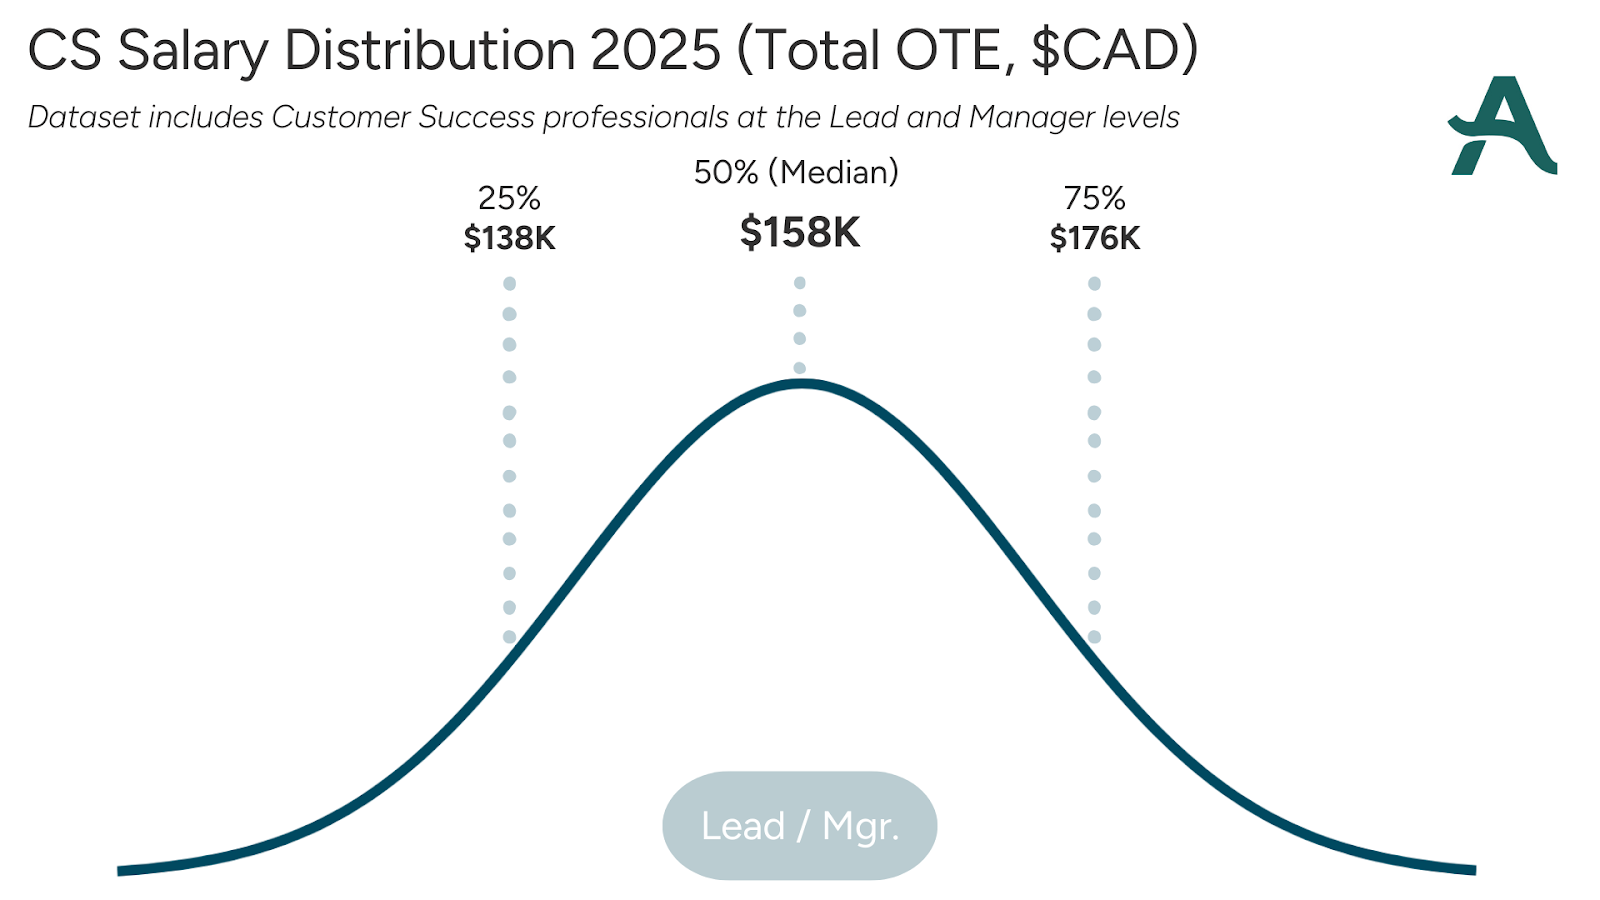
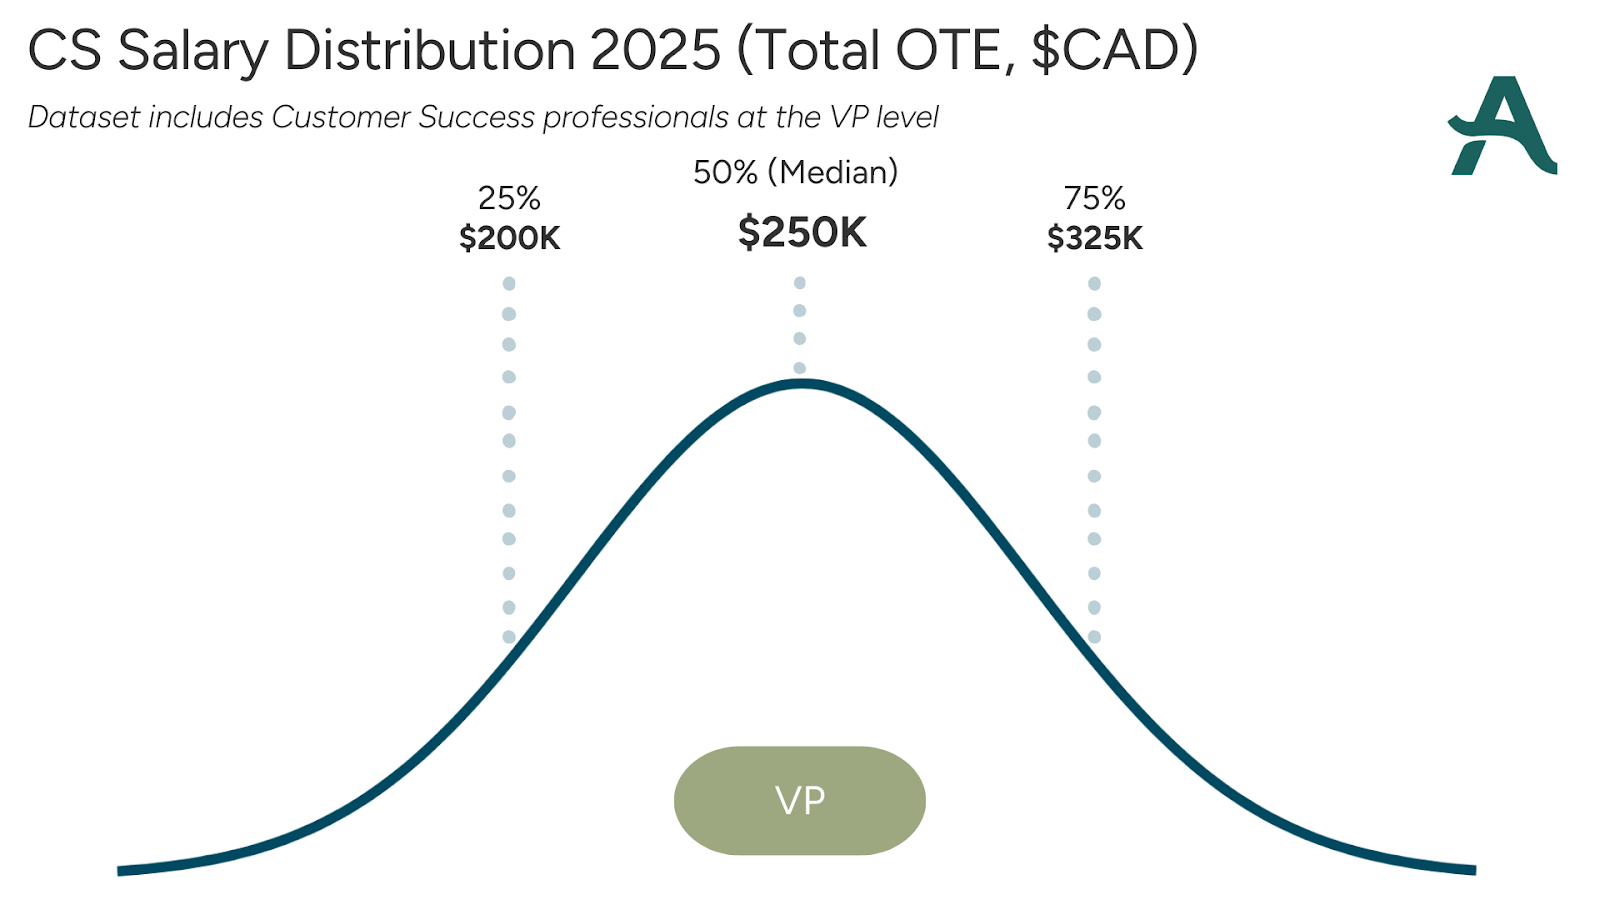
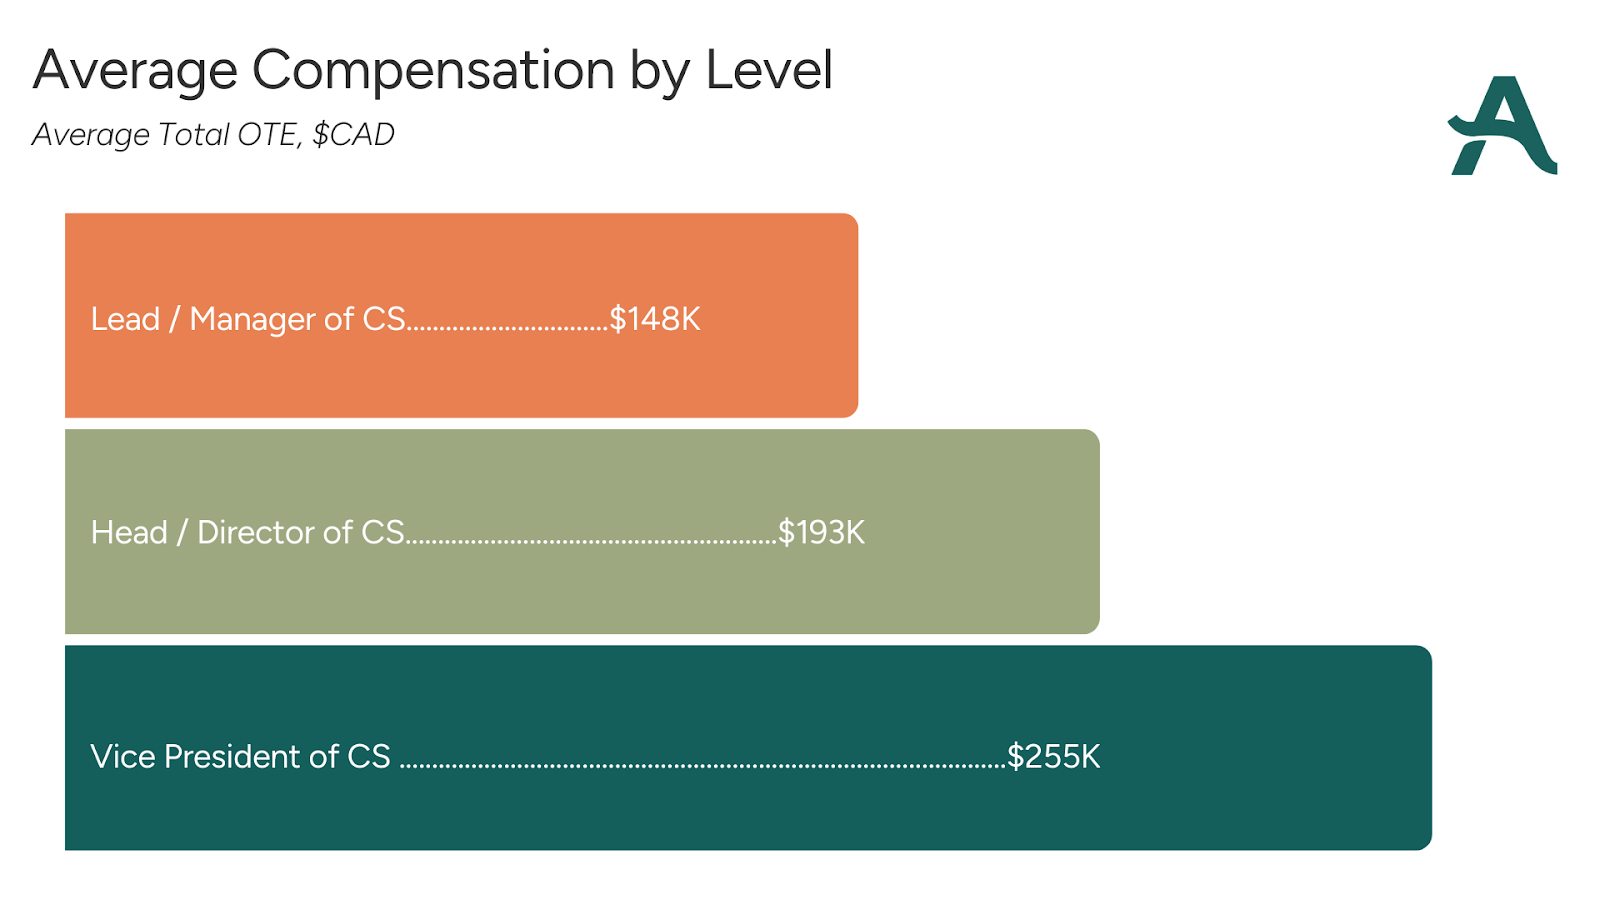
Compensation By Level
This data reflects total on Median target earnings (OTE), including base salary and performance-based bonus or variable compensation. All figures are in Canadian dollars.
On Target Earnings (OTE) usually consists of a base salary plus a variable/ bonus component. Below you will find the breakdown of base and % of base salary as a bonus.
There is a shift occurring toward a more equal balance between hybrid and fully remote work environments. Return-to-office (RTO) policies are entering the conversation as well, though they still represent only a small percentage of work arrangements for customer success professionals.
This snapshot reflects verified data gathered from a combination of recent searches and our proprietary salary survey.
Because of this, our figures may reflect the upper end of the market.
We do not include dollar values for equity due to the complexity of evaluating early-stage or private company stock.
Salary transparency supports better hiring, fairer compensation, and stronger negotiation on both sides of the table. That is why we created our Salary Snapshot Series.
We base this on the four Ts:
Feel free to share this snapshot with your network or explore our other Salary Snapshot reports on artemiscanada.com.

Read more insights from our team.
.jpg)
.jpg)

Founded by Kristina McDougall in 2013, Artemis has grown to become Canada’s most trusted boutique executive search firm for startups.
We recognize that our work takes place on the traditional lands of the Attawandaron, Anishinaabeg, Haudenosaunee, and Mississaugas of the Credit. We honour Indigenous stewardship and commit to embedding reconciliation into our work, holding ourselves and our clients accountable.