

.jpg)
At Artemis Canada, we work with founders and executive teams across the country who are building ambitious technology companies. For more than a decade, we’ve been in the room for critical leadership hires, compensation conversations, and board-level decisions about how to structure teams for growth.
Because our work spans product, engineering, go-to-market, people, finance, and beyond, we see how compensation is shifting across the tech ecosystem in real time, not just in one company or one stage. These Salary Snapshots are our way of sharing that view back with you.
Each guide focuses on a single function and blends quantitative survey data with what we’re hearing every day from candidates and companies. If this is your first time encountering Artemis Canada, think of this as a practical, Canada-focused benchmark to help you answer three questions: Where does my team sit in the market? What kind of leader do we really need next? And what will it take to attract and retain them?
This salary guide draws from our 2026 Salary Survey and our real-time conversations with Canada’s top sales and revenue leaders, capturing compensation, work models, well-being, AI adoption, and market sentiment from sales professionals across startups, scale-ups, and technology-led organizations.
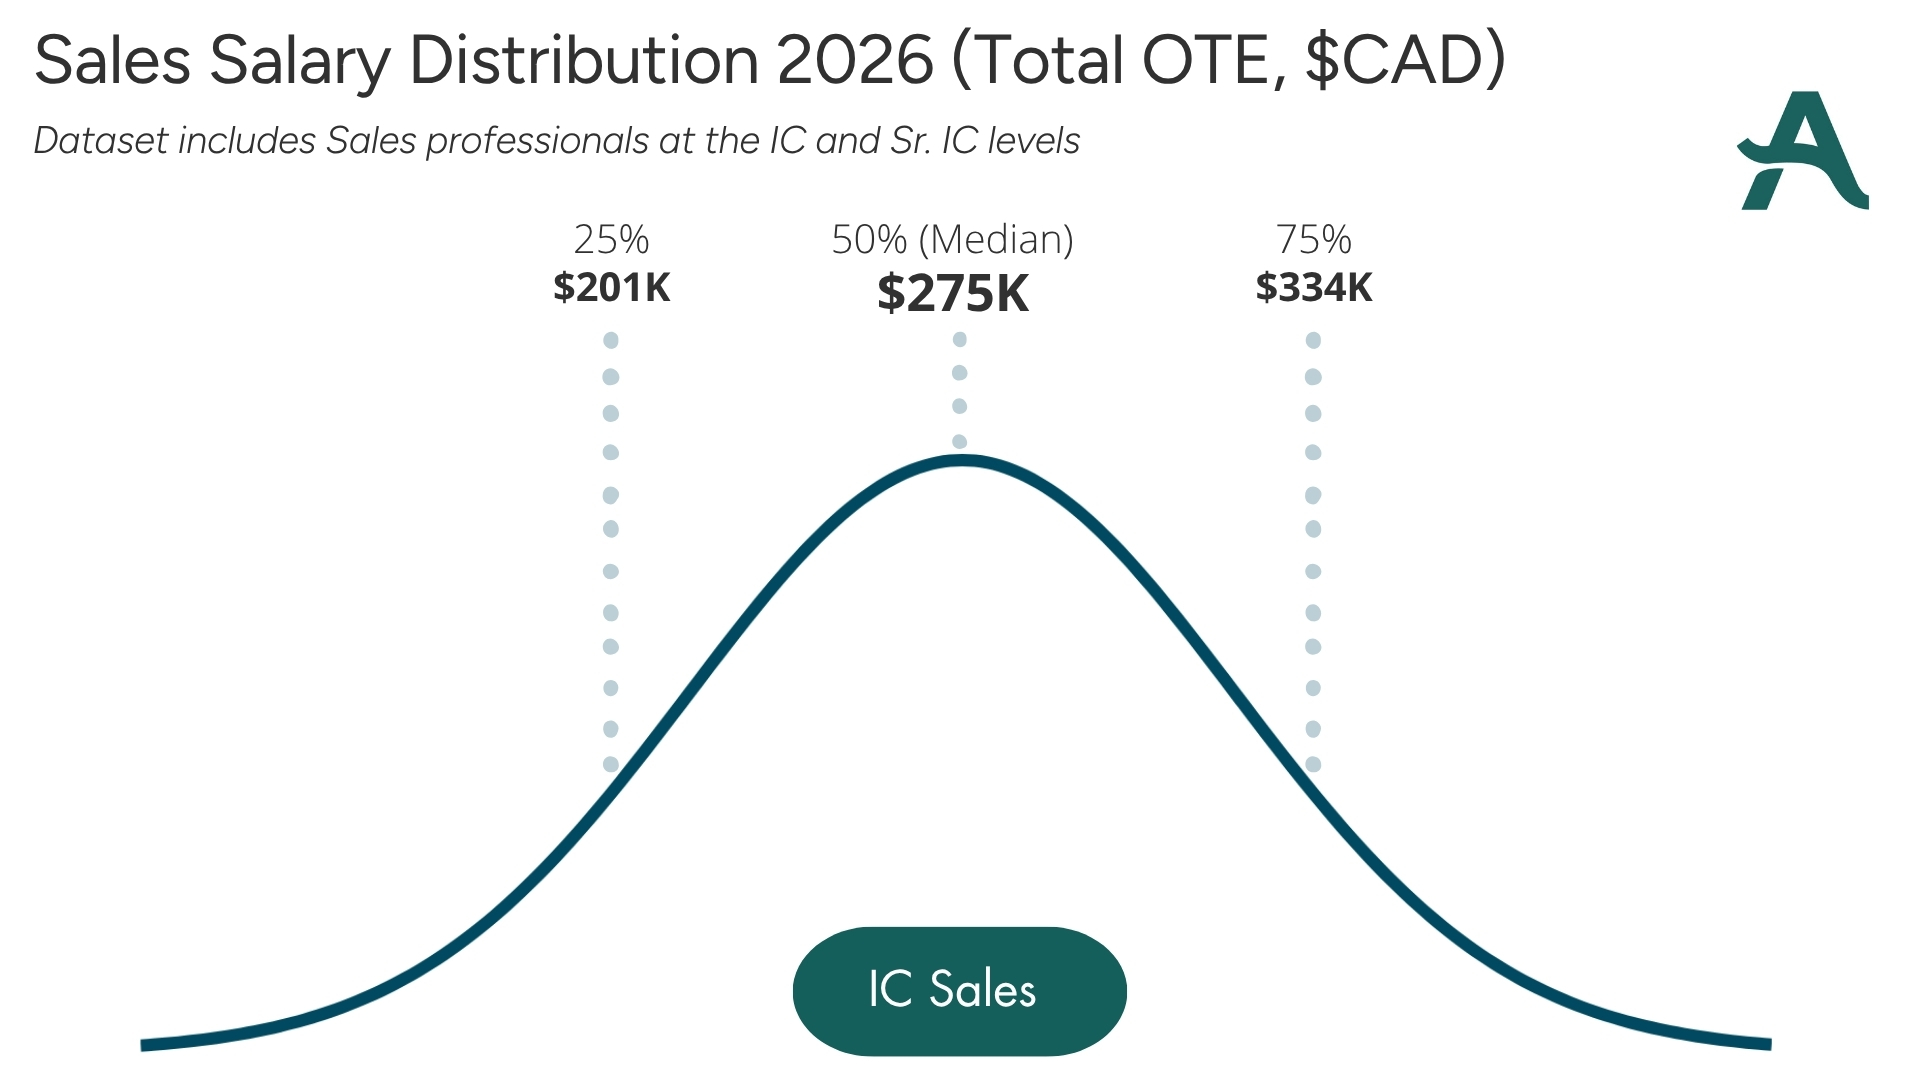
This data reflects On Target Earnings (OTE), excluding equity. All figures are in Canadian dollars.
But wait! Before you dig in and get to comparing (yup, we see you!), here is some helpful context:
With those caveats out of the way, let’s dig in.
.jpg)
.jpg)
.jpg)
.jpg)
.jpg)
Across all respondents, the median base salary was $180K and the average base salary was $193K. The middle of the market ranged from $150K at the 25th percentile to $227K at the 75th percentile, with the 90th percentile reaching $297K.
The spread between levels shows a clear premium for senior sales leadership, but it also highlights an important nuance in sales: individual contributors can still command strong base salaries when they own complex enterprise motions, strategic accounts, or high-value revenue targets.
As we see often in search, title matters, but mandate matters more. A sales leader responsible for revenue strategy, team performance, forecasting discipline, market expansion, and executive-level customer relationships will sit in a very different range than a narrower sales management role.
.jpg)
Equity remains a meaningful part of total compensation for sales leaders and senior revenue talent. 50% of respondents reported having equity. Among those who did, the median equity value was $175K and the average was $518K. The 75th percentile was $438.5K, while the 90th percentile reached $1.1M.
The wide gap between median and average equity suggests that a smaller number of larger grants are pulling the average upward. This is especially common in sales, where equity can vary significantly by company stage, role level, and whether the leader is joining before or after meaningful revenue scale.
For startups and scale-ups, equity can still be a strong differentiator, especially when cash compensation cannot stretch to the top of market. But candidates are increasingly thoughtful about how they evaluate it. They want to understand company stage, valuation, strike price, vesting, and what the grant could realistically become. Equity is compelling when it is clear.
Bonuses and variable compensation are central to sales compensation.
76% of respondents reported receiving a reliable bonus. Across those respondents, the median bonus was $140K and the average bonus was $158K. The 75th percentile was $225K, while the 90th percentile reached $298K.
.jpg)
For sales roles, variable compensation has to be credible. A strong OTE only works when the target is realistic, the territory is clear, the sales motion is understood, and the company has the product, market, and pipeline support to make the plan achievable.
The best sales compensation structures are simple, credible, and tied to outcomes the leader or seller can meaningfully influence. When a sales leader is accountable for revenue, quota attainment, forecast quality, team performance, expansion, and customer acquisition, variable compensation can create strong alignment, but only when the goals are clear.
The bigger takeaway: flexibility continues to matter in sales. While in-person collaboration can be valuable for coaching, onboarding, and team rhythm, many sales professionals have built effective operating models around remote customer engagement.
For hiring teams, the key is clarity. Be upfront about travel expectations, office expectations, territory coverage, customer-facing requirements, and what flexibility actually looks like day to day.
AI is now part of the sales toolkit. 83% of respondents use AI tools every day, and 18% use them occasionally. No respondents said they do not use AI.
Most Common AI Use Cases
For sales leaders, AI fluency is becoming table stakes. The strongest sales professionals are not simply using tools to write faster emails. They are using AI to research accounts, prepare for conversations, summarize customer context, improve follow-up, sharpen messaging, and create more space for high-quality selling.
That said, AI does not replace judgment. In sales, trust still matters. The best use of AI supports stronger preparation and better customer conversations, it does not replace the human work of listening, diagnosing, and building confidence.
Compensation is only one part of how sales professionals evaluate their roles.
That gap is worth paying attention to. Sales professionals may be doing reasonably well personally, but many are feeling more pressure inside the workplace. Quota expectations, pipeline quality, changing targets, tighter buyer budgets, and unclear compensation plans can all shape how sales teams experience their roles.
For leaders, this is a reminder that retention is not only about compensation. It is also about target credibility, manager support, enablement, territory design, product-market fit, trust, and whether the team has a realistic path to success.
Most sales respondents reported compensation growth since 2021.
30% said their compensation increased significantly, while 40% said it increased slightly. 25% said it stayed about the same, 3% said it decreased slightly, and 3% said it decreased significantly.
This suggests sales compensation is still moving upward for many respondents, but not evenly. In a function where total compensation is tied closely to performance, territory, company stage, and market conditions, the lived experience can vary significantly from one seller or leader to another.
83% of sales respondents use AI every day, and no respondents said they do not use it. Sales professionals are using AI heavily for brainstorming, research, writing, productivity, and summarizing, all closely tied to preparation, communication, and customer engagement.
Last year, only 40.6% of sales respondents were remote, while 50% were hybrid. This year, 55% are fully remote and 38% are hybrid. That is a meaningful shift back toward remote-first sales work.
Only 38% of respondents are satisfied or extremely satisfied with their compensation, even though 70% reported some compensation increase since 2024. This may reflect pressure around quota attainment, variable compensation, territory design, or changing expectations around what “good” sales compensation should look like.
Sales respondents reported an employer NPS of -20, with detractors outnumbering promoters. For companies, that is an important signal. Sales teams may be open to change when they do not see a clear path to success, even if their base compensation is competitive.
76% of respondents reported receiving a reliable bonus, with a median bonus of $140K. Sales remains one of the functions where total compensation is most directly shaped by performance-based upside.
Half of respondents reported having equity, with a median value of $175K. For senior sales and revenue leaders, equity can still be a meaningful part of the total package, especially when they are joining at a stage where their work can materially influence company growth.
Sales compensation in 2026 reflects a function that is still deeply tied to growth, performance, and market confidence.
The strongest sales leaders are being asked to build predictable revenue, improve team performance, sharpen forecasting, coach through complexity, and create stronger alignment across the business. They are also navigating new expectations around AI, remote work, buyer caution, leaner teams, and clearer accountability.
For companies, the takeaway is simple: compensation is not just a number to benchmark. It is a signal. It tells candidates how you value the role, how clearly you understand the mandate, and how serious you are about building the right leadership foundation for growth.
A thoughtful offer does not always mean the highest offer. It means the right mix of base salary, variable compensation, equity, flexibility, scope, and trust, aligned to what you need this leader or seller to help you achieve.
If you are hiring a sales leader, reviewing your current compensation strategy, or trying to understand where your team sits in the market, we’re here to help you make sense of the data and apply it to your business.
Great sales leaders can change the trajectory of a company. We’re here to help you get set up to attract and retain them.
This snapshot reflects data from our annual salary survey and one-on-one candidate conversations. Our network — and so, our respondents — are mostly gainfully employed at high-performing tech startups and scale-ups across Canada. Because of this, our figures may reflect the upper end of the market.
Respondents include individual contributors, managers, directors, heads of function, VPs, C-level leaders, and consultants or freelancers. The respondent pool is heavily rooted in Canada, with 91% of respondents currently located in Canada and 9% located in the US.
Company headquarters varied:
The respondent pool was 70% male and 30% female. No respondents identified as non-binary in this dataset.
Company size varied across the sample:
As with all salary data, context matters. Company stage, mandate, team size, quota expectations, ACV, territory, sales motion, revenue maturity, geography, and scope of leadership can all influence compensation.
Salary transparency supports better hiring, fairer compensation, and stronger negotiation on both sides of the table. That is why we created our Salary Snapshot Series.
We base this on the four Ts:
Targeted to Canadian tech companies and candidates
Timely with current market data
Trustworthy thanks to real survey responses and market conversations
Trim with clear insights and relevant context, without unnecessary noise
Great sales leaders do more than manage quota. They build revenue discipline, create trust with customers, develop stronger teams, improve forecast quality, and help companies grow with focus.
If you are hiring a sales leader, planning your next stage of growth, or benchmarking your current team, we hope this snapshot helps you make clearer, more confident decisions.

Read more insights from our team.
.png)
.png)

Founded by Kristina McDougall in 2013, Artemis has grown to become Canada’s most trusted boutique executive search firm for startups.
We recognize that our work takes place on the traditional lands of the Attawandaron, Anishinaabeg, Haudenosaunee, and Mississaugas of the Credit. We honour Indigenous stewardship and commit to embedding reconciliation into our work, holding ourselves and our clients accountable.
