

.jpg)
At Artemis Canada, we work with founders and executive teams across the country who are building ambitious technology companies. For more than a decade, we’ve been in the room for critical leadership hires, compensation conversations, and board-level decisions about how to structure teams for growth.
Because our work spans product, engineering, go-to-market, people, finance, and beyond, we see how compensation is shifting across the tech ecosystem in real time, not just in one company or one stage. These Salary Snapshots are our way of sharing that view back with you.
Each guide focuses on a single function and blends quantitative survey data with what we’re hearing every day from candidates and companies. If this is your first time encountering Artemis Canada, think of this as a practical, Canada-focused benchmark to help you answer three questions: Where does my team sit in the market? What kind of leader do we really need next? And what will it take to attract and retain them?
This salary guide draws from our 2026 Salary Survey and our real-time conversations with Canada’s top technical leaders, capturing compensation, work models, well-being, AI adoption, and market sentiment from engineering professionals across startups, scale-ups, and technology-led organizations.
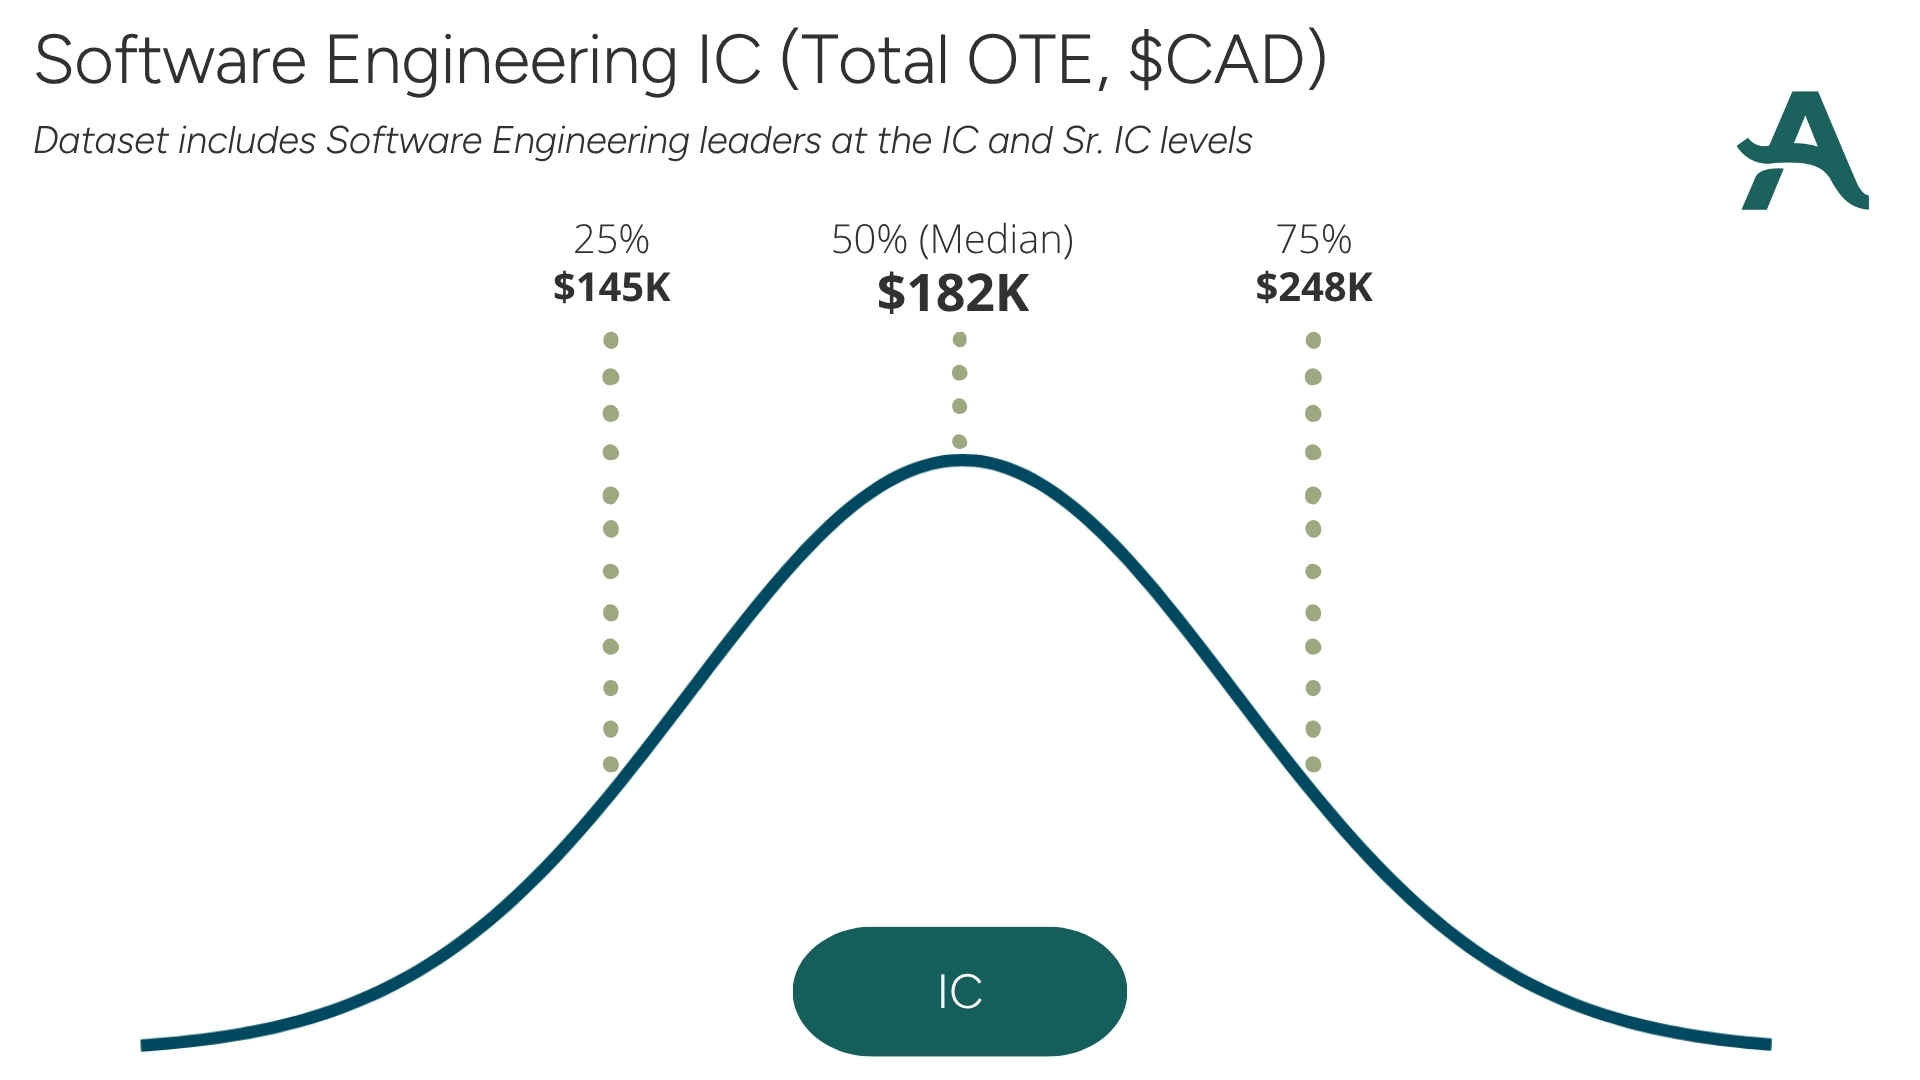
This data reflects On Target Earnings (OTE), excluding equity. All figures are in Canadian dollars.
But wait! Before you dig in and get to comparing (yup, we see you!), here is some helpful context:
With those caveats out of the way, let’s dig in.
.jpg)
.jpg)
.jpg)
.jpg)
.jpg)
Across all respondents, the median base salary was $200K and the average base salary was $214K. The middle of the market ranged from $160K at the 25th percentile to $250K at the 75th percentile, with the 90th percentile reaching $301K.
The spread between levels shows a clear premium for senior technical leadership, especially when the role includes responsibility for architecture, engineering strategy, team leadership, scalability, security, AI integration, and technical decision-making.
It also reinforces something we see often in search: title matters, but mandate matters more. A technical leader responsible for platform direction, engineering quality, security posture, AI strategy, and executive-level trade-offs will sit in a very different compensation range than a narrower team management or delivery role.
Equity remains part of Software Engineering compensation, especially in venture-backed and growth-stage environments.
42% of respondents reported having equity. Among those who did, the median equity value was $120K and the average was $379K. The 75th percentile was $200K, while the 90th percentile reached $1M.
The gap between median and average equity suggests that a smaller number of larger grants are pulling the average upward. This is common in engineering, where senior technical leaders and executives may receive materially larger grants than individual contributors or managers.
For startups and scale-ups, equity can still be a strong differentiator, especially when cash compensation cannot stretch to the top of market. But candidates are increasingly thoughtful about how they evaluate it. They want to understand company stage, valuation, strike price, vesting, and what the grant could realistically become.
Equity is compelling when it is clear.
Bonuses are part of the engineering compensation picture, but they are not universal.
47% of respondents reported having a bonus. Across those respondents, the median bonus was $30K and the average bonus was $46.7K. The 75th percentile was $52.3K, while the 90th percentile reached $94.8K.
For engineering roles, bonus structures can vary widely. Some are tied to company performance. Others reflect delivery milestones, technical outcomes, leadership goals, security or reliability targets, or executive-level priorities.
For hiring teams, the best bonus structures are simple, credible, and tied to outcomes the leader can meaningfully influence. When an engineering leader is accountable for delivery, architecture, quality, uptime, security, AI adoption, hiring, or team performance, variable compensation can help align expectations — but only when the goals are clear.
Remote work remains the dominant model in Software Engineering.
In 2026, 51% of respondents are fully remote, 34% are hybrid, and 16% are fully in-office.
That is a shift from last year’s Software Engineering snapshot, which focused more heavily on compensation growth and technical leadership trends than work model distribution. The 2026 data shows that, despite broader return-to-office conversations, engineering remains one of the more flexible functions in tech.
The bigger takeaway: flexibility continues to matter. Many engineering teams have proven they can build, ship, and collaborate effectively in distributed environments. That said, hybrid or in-person time can still be valuable for architecture discussions, onboarding, mentoring, incident reviews, and team trust.
For hiring teams, the key is clarity. Be upfront about office expectations, collaboration rhythms, incident coverage, timezone requirements, and whether the role requires hands-on proximity to teams, customers, or hardware.
AI is now deeply embedded in engineering work.
66% of respondents use AI tools every day, 33% use them occasionally, 1% are not using AI but planning to, and 0% said they do not use AI.
Most Common AI Use Cases
For engineering leaders, AI fluency is becoming table stakes. The strongest technical professionals are not simply using AI to generate code faster. They are using it to accelerate debugging, improve documentation, support technical learning, automate repetitive work, pressure-test ideas, and create more space for higher-quality systems thinking.
The opportunity is real, but so is the responsibility. AI can support engineering productivity, but judgment, code quality, security, maintainability, and architectural decisions still sit with the team.
Compensation is only one part of how engineering professionals evaluate their roles.
That gap is worth paying attention to. Engineering teams often carry high expectations around delivery, quality, uptime, technical debt, security, and AI adoption — sometimes while operating with leaner teams than in previous growth cycles.
For leaders, this is a reminder that retention is not only about compensation. It is also about clarity, technical direction, realistic roadmaps, engineering standards, manager support, autonomy, and whether teams have the space to build well.
.jpg)
Most engineering respondents reported compensation growth since 2021.
22% said their compensation increased significantly, while 42% said it increased slightly. 26% said it stayed about the same, 6% said it decreased slightly, 2% said it decreased significantly, and 2% were unsure or preferred not to answer.
This suggests engineering compensation is still moving upward for many respondents, though mostly through modest increases rather than dramatic jumps.
Engineering Compensation Remains Strong
The median base salary across respondents was $200K, with the 75th percentile at $250K and the 90th percentile just over $300K. Senior technical leaders continue to command strong compensation, especially when the mandate includes architecture, scalability, security, AI, and team leadership.
AI Is A Core Engineering Workflow
66% of respondents use AI every day, and 80% use it for coding and technical problem solving. This is the clearest functional difference in the AI data: for engineering, AI is not just supporting communication or productivity. It is directly connected to how technical work gets done.
Remote Work Still Leads
51% of respondents are fully remote, compared with 34% hybrid and 16% fully in-office. Engineering remains one of the more flexible functions, though in-office expectations may still show up for leadership, onboarding, mentorship, or highly collaborative technical work.
Equity Is Meaningful, But Uneven
42% of respondents reported having equity, with a median value of $120K and a 90th percentile of $1M. The spread is wide, which likely reflects differences in seniority, company stage, grant timing, and whether respondents are at private or later-stage companies.
Employer Sentiment Is Slightly Negative
Engineering respondents reported an employer NPS of -7. That is not as low as some other functions, but detractors still outnumber promoters. For companies, this is a useful signal: engineering talent may be satisfied enough to stay, but not necessarily enthusiastic enough to advocate.
Compensation Is Still Moving Up
64% of respondents said their compensation increased either slightly or significantly since 2024. The market is not moving at 2021 speed, but strong engineering talent remains expensive and important.
Conclusion
Software Engineering compensation in 2026 reflects a function that continues to sit at the centre of company-building.
The strongest engineering leaders are being asked to balance technical depth, team leadership, AI adoption, platform quality, security, delivery speed, and long-term scalability. They are also navigating leaner teams, higher expectations, and a market where technical decisions can shape the trajectory of the business.
For companies, the takeaway is simple: compensation is not just a number to benchmark. It is a signal. It tells candidates how you value the role, how clearly you understand the mandate, and how serious you are about building the right technical foundation for growth.
A thoughtful offer does not always mean the highest offer. It means the right mix of base salary, bonus, equity, flexibility, scope, and trust — aligned to what you need this leader to help you achieve.
If you are hiring an engineering leader, reviewing your current compensation strategy, or trying to understand where your team sits in the market, we’re here to help you make sense of the data and apply it to your business.
Great engineering leaders can change the trajectory of a company. We’re here to help you get set up to attract and retain them.
This snapshot reflects data from our annual salary survey and one-on-one candidate conversations. Our network — and so, our respondents — are mostly gainfully employed at high-performing tech startups and scale-ups across Canada. Because of this, our figures may reflect the upper end of the market.
Respondents include individual contributors, managers, directors, heads of function, VPs, C-level leaders, and consultants or freelancers. The respondent pool is heavily rooted in Canada, with 98% of respondents currently located in Canada and 2% located in the US.
Company headquarters varied:
The respondent pool was 88% male and 12% female. No respondents identified as non-binary in this dataset.
Company size varied across the sample:
As with all salary data, context matters. Company stage, mandate, technical complexity, architecture scope, team size, AI exposure, security requirements, geography, and scope of leadership can all influence compensation.
Salary transparency supports better hiring, fairer compensation, and stronger negotiation on both sides of the table. That is why we created our Salary Snapshot Series.
We base this on the four Ts:
Targeted to Canadian tech companies and candidates
Timely with current market data
Trustworthy thanks to real survey responses and market conversations
Trim with clear insights and relevant context, without unnecessary noise
Great engineering leaders do more than ship software. They build resilient systems, raise technical standards, support strong teams, manage complexity, and help companies build products that can scale.
If you are hiring an engineering leader, planning your next stage of growth, or benchmarking your current team, we hope this snapshot helps you make clearer, more confident decisions.

Read more insights from our team.
.png)
.png)

Founded by Kristina McDougall in 2013, Artemis has grown to become Canada’s most trusted boutique executive search firm for startups.
We recognize that our work takes place on the traditional lands of the Attawandaron, Anishinaabeg, Haudenosaunee, and Mississaugas of the Credit. We honour Indigenous stewardship and commit to embedding reconciliation into our work, holding ourselves and our clients accountable.
